

The Power of Error: Forest Carbon Accounting the World Cannot Defend

How Systemically Generated Compounding Uncertainties in Forest Management Produce Carbon Accounts the World Cannot Defend
By John Profitt
B.Sc. Geological Engineering · P.Eng., Engineers and Geoscientists of BC · GSC Gold Seal Certified · LEED Accredited Professional · Licensed BC Builder · Principal & Founder, Nextlevel Modular Inc.
This paper asks questions. It does not render verdicts.
PREAMBLE
The questions are grounded in field observation, published science, and the documented uncertainty ranges of the systems under examination. They are questions that any diligent engineer, scientist, or policy maker would be obligated to ask given the same evidence. The fact that they have not been widely asked, that the downstream technology stack of the global construction industry has been built on assumptions that appear not to have been field-validated at the scale their application demands, is itself the central finding of this paper.
The authors of the systems examined here are not accused of deception. They are not accused of negligence. They are operating within frameworks that were built incrementally, by many hands, over many decades, with the best available science at each step. The problem this paper identifies is not personal. It is structural. It is the problem of a chain of models, each inheriting the optimistic assumptions of the one before it, producing outputs that carry the appearance of precision without the substance of verified accuracy.
There is a deeper context that shapes why the questions this paper asks have gone unanswered for so long. Since the 1960s, the pace of technological advancement, economic growth, and human population expansion has been extraordinary. The Dow Jones, the NASDAQ, computing power, global trade volumes, all of them have moved on curves that felt like progress. What those curves concealed was an equally accelerating draw on the natural systems sustaining them. The measure of economic life is a flash on the geological clock. Some trees that were alive when the forests documented in this paper were harvested had already stood for five centuries. The carbon they stored was not an accounting category. It was a relationship between deep time and a living system. That relationship is the original standard from which this paper asks, urgently, that we begin measuring again.
The authors of those systems are invited to answer the questions the evidence makes unavoidable. The construction industry professionals, carbon accountants, certification bodies, and policy makers who rely on those systems are invited to ask whether the answers they have been given are sufficient. The forest, what remains of it, cannot wait for a more convenient moment.
The goal is not to make people feel attacked. It is to make them unable to avoid the question.
SECTION I
The Carpenter's Lesson
Every apprentice carpenter learns a rule early. When you need to cut a series of identical blocks, do not use the last cut piece as the template for the next. Measure from the original standard each time. The reason is simple and unforgiving: no cut is perfect. Every piece of lumber is fractionally longer or shorter than intended. If you copy from the copy, the error does not stay the same, it multiplies. By the tenth block, the drift is visible. By the thirtieth, the structure does not fit together. By the fiftieth, you are building something that bears no relationship to the original design.
This is not a lesson about carpentry. It is a lesson about the nature of compounding error in any system that measures, models, and makes consequential decisions across a chain of dependent assumptions. And it is the precise mechanism by which the world's forest management systems, from the boreal expanses of Russia, Scandinavia, and Canada to the tropical forests of the Amazon and Congo Basin, from the plantation corridors of Southeast Asia to the managed timberlands of the Pacific Northwest, have drifted so far from defensible truth that the gap between what was promised in terms of regenerated forest and the ability to sequester carbon and what was delivered can now be measured in decades of missing carbon, hundreds of millions of hectares of failed habitat, and a planetary carbon accounting ledger that does not balance.
Every jurisdiction with a managed forest carbon claim shares the same foundational architecture: an inventory of standing timber feeds assumptions about future growth, which feed projections about sustainable harvest levels, which feed the allowable cut determinations that governments publish as defensible science. The names change, the Annual Allowable Cut in Canada, the Allowable Sale Quantity in the United States, the felling licence frameworks of Scandinavia, the concession volumes of the tropical timber trade, but the structure is identical. And the structural vulnerability is identical: each model in the chain inherits the assumptions and uncertainties of the model before it, and at each step, when uncertainty exists and a choice must be made, the system has historically resolved that uncertainty in favour of maintaining or accelerating harvest levels.
Forest inventory data, imprecise by design and often decades out of date, feeds into growth and yield models built on limited trial plots and optimistic silvicultural assumptions.
Those models feed into disturbance projections that have consistently underestimated the scale of fire, beetle, drought, and wind mortality in a warming climate.
Those projections feed into land base definitions that determine what counts as "hoperable" (accessible to harvesting equipment) or "harvestable" forest. And that defined land base feeds into the harvest determination process, a number presented to the public, to industry, and to downstream carbon accounting systems with a precision that the underlying uncertainty does not remotely support.
The carpenter kept cutting from the last block, not noticing that the last block was already shorter than it should have been.

If the published Annual Allowable Cut is the entire rectangle, the forest has been harvested as though timber were an endlessly renewing resource. The honest uncertainty analysis suggests the defensible harvest is the small green box in the corner. The difference between the two is not waste in the conventional sense. It is structural overcutting, built into the system by design, compounding silently for five decades, and recorded nowhere in the carbon accounting frameworks the construction industry relies on today.
The result is what engineers would recognise as a system without a unified error budget. No mechanism exists in any major timber-producing jurisdiction to propagate uncertainty from the inventory stage through to the final harvest determination and ask: given everything we do not know with confidence, what is the true range of defensible harvest levels? If such an analysis were performed with honest uncertainty ranges, inventory at ±20 percent, growth and yield at ±20 percent, disturbance at ±40 percent, non-timber values largely unquantified, the cumulative uncertainty in allowable harvest figures would approach ±30 to 60 percent across most managed forest regions. The system presents a single number. It does not present the range. And the single number, in jurisdiction after jurisdiction, sits at the optimistic end of the range that honest uncertainty analysis would produce.
This pattern is not confined to any single country or forest type. The boreal forests of Russia and Canada, which together represent the largest terrestrial carbon reservoir on Earth, are managed under harvest frameworks that carry the same structural bias toward optimistic inventory assumptions and underestimated disturbance. The tropical forest concession systems of Brazil, Indonesia, and the Democratic Republic of Congo operate under volume calculations that consistently overstate sustainable yield and understate the carbon consequence of extraction. The plantation forestry sectors of Chile, New Zealand, and Scandinavia feed downstream carbon credit and embodied carbon accounting systems with growth curve assumptions that field measurement frequently does not support.
This paper does not argue that the foresters, engineers, and policy makers operating within these systems are acting in bad faith.
It argues something more structurally troubling: that the systems were designed in a way that makes the compounding of optimistic assumptions the path of least resistance at every decision point, and that the downstream consequences of that design, for carbon accounting, for habitat, for the credibility of every green building certification and embodied carbon database that draws on managed forest assumptions, are now large enough to constitute a crisis of institutional integrity that no jurisdiction can afford to ignore.
The field evidence presented in Section 3 of this paper is drawn from a 400-kilometre field survey corridor in interior British Columbia, Canada, a precisely documented window into a global pattern. The plantation stands photographed along the Coquihalla Highway and at Pennask Summit are not exceptional failures. They are representative examples of what managed forest recovery looks like in the area, at 38 to 46 years of age, on sites where the harvest was recorded, the replanting was documented, and the signs claiming carbon storage and habitat improvement were erected in plain sight of the travelling public. What those signs claim, and what a camera and a tape measure confirm, are not the same thing. They have not been the same thing for decades. And the carbon accounting systems that treat the claim as the reality have been cutting from the last block ever since.
How can a full carbon credit be issued when the relative sequestration of a replacement plantation is a small fraction of the original forest? That question has not been asked at scale. This paper asks it.
The chapters that follow trace that chain of error from its origin in the forest inventory to its terminus in the procurement databases and carbon credit frameworks used across the world. But the most direct evidence in this paper requires no model and no database. It requires a camera, a tape measure, and the willingness to stand beside what the model said would be a recovering forest and look at what is actually there. What Section 3 documents at six field stops along a 400-kilometre independent survey corridor in interior British Columbia, Canada raises a question that every carbon credit, every EPD, and every mass timber certification built on managed forest assumptions must answer: if the replacement forest is still a net carbon source for 7 to 15 years after harvest, and still delivering a fraction of its modelled sequestration capacity 46 years after planting, on what evidential basis is a full carbon credit being issued from planting day?
SECTION II
How Governments Decide Which Forests to Cut
The Chain of Models and Where It Breaks
To understand how the error compounds, it is necessary to understand the decision chain that produces a harvest allowance, and to understand it not as a technical process whose outputs can be taken at face value, but as a sequence of human judgments, each one made under conditions of genuine uncertainty, each one capable of introducing a directional bias that the next step in the chain inherits without question.
Error tolerance summary - the compounded result at a glance
The table below presents the uncertainty ranges supported by published science at each step in the harvest determination chain. Supporting references for each range are cited in the Recommended References section. The supporting analysis for each figure follows in the subsections beneath. The cumulative figure, never disclosed by any jurisdiction, never propagated into the downstream carbon accounting systems that rely on these numbers, is the central quantitative finding of this paper.
Chain step | Uncertainty range | Key bias driver |
Forest inventory | ±10–40% | Optimistic volume estimates; complex terrain & old-growth under-measured |
Growth & yield modelling | ±15–30% | Trial plots skewed to better sites; climate effects not integrated |
Natural disturbance projections | ±20–60% | Historical calibration obsolete; fire, beetle, acid rain, drought accelerating |
Old-growth & non-timber values | Unquantified | Mapping gaps systematically favour harvest; rare ecosystems missed |
Professional reliance interpretations | Structural bias | Licensee-hired professionals; directional pressure toward harvest |
Cumulative harvest allowance uncertainty | ±30–60%+ | Never disclosed. Never propagated downstream. |
Read across the table and the conclusion is unavoidable: a harvest allowance carrying ±30 to 60 percent cumulative uncertainty, presented as a single precise figure, is not a measurement. It is a policy choice wearing the clothing of science. The subsections that follow examine each row in detail.
A. Forest Inventory - The First Cut
Forest inventory uncertainty is not a marginal rounding error. Studies examining the accuracy of volume estimates derived from LiDAR, aerial photography, and sample plot extrapolation consistently report uncertainty ranges of ±10 to 40 percent at the stand level, with higher uncertainty in structurally complex old-growth and steep terrain. The uncertainty is not random. It is directionally biased: the features of a forest that are hardest to measure accurately, the multi-layered structure of old growth, the carbon density of deep organic soils, the biomass of understory and coarse woody debris, are precisely the features that carry the greatest carbon significance. What the inventory measures well is merchantable timber volume. What it measures poorly is everything else.
And the harvest decision is made on what the inventory measures well.
Compounding the measurement problem is the currency problem. In vast areas of boreal and tropical forest, the inventory data informing current harvest decisions was collected years or decades ago. A forest inventory conducted in 1995 using aerial photography and ground plot sampling does not accurately represent the same forest in 2026, a forest that has been subjected to three decades of accelerating climate stress, beetle pressure, fire, and drought. The inventory that informs the harvest decision is a photograph of a world that no longer exists. The harvest proceeds as though it does.
B. Growth and Yield Modelling — The Second Cut
Growth and yield models for managed forests are built on data from trial plots, monitored stands where growth has been measured over years or decades under controlled silvicultural conditions. Those trial plots are not representative of the full range of sites, species mixes, soil conditions, and climate exposures that characterise the forests to which the models are applied. They tend to be established on better sites, under more intensive management, with more monitoring resources than the average managed stand receives. Their yields tend to be higher than the population average.
And those above-average yields become the assumption embedded in the model, which becomes the assumption embedded in the harvest allowance.
The 400-kilometre independent field survey documented in Section 3 raises a direct question about whether those assumptions are holding. Plantation stands at six documented sites, planted between 1978 and 1988 by named licensees under documented management plans, show trunk diameters of 4 to 10 inches and heights of 16 to 48 feet at ages of 38 to 46 years. Growth and yield models for managed lodgepole pine and interior spruce in comparable site conditions project significantly higher volumes at equivalent ages.
C. Natural Disturbance Projections - The Third Cut
Disturbance projections are the mechanism by which fire, insect, disease, wind, drought, and atmospheric deposition are factored into harvest allowances. They are also the step where the gap between modelled expectation and observed reality has been most dramatically exposed. In British Columbia, the mountain pine beetle epidemic killed an estimated 700 million cubic metres of timber, a volume not predicted at the scale at which it occurred. Across Siberia, fire seasons in the 21st century exceed any historical precedent. In Central Europe, bark beetle outbreaks accelerated by warming and drought have devastated mountain forests.
In each case, disturbance models were calibrated on historical patterns that climate change has rendered obsolete.
A less visible but equally consequential stressor is acid deposition. Prevailing jet streams carry industrial pollution, sulphur dioxide and nitrogen oxides from manufacturing, coal combustion, and smelting operations around the world, across oceans and continents, depositing it as weak acid in precipitation falling on forests globally, including those of British Columbia and the broader Pacific Northwest. This is documented in soil chemistry studies and lichen community monitoring. Acid deposition degrades the mycorrhizal networks that connect trees to soil nutrients, leaches base cations from the soil horizon, and alters the microbial communities responsible for nutrient cycling.
A forest growing in chronically acidified soil is a forest under physiological stress that does not appear in the inventory, does not appear in the growth model, does not appear in the disturbance projection, and does not show visually to a passerby.
It appears, eventually, in the gap between what the model said the plantation would grow and what the tape measure finds forty years later.
D. Non-Timber Values and Old-Growth Classification - The Fourth Cut
Old-growth forests are not simply old trees. They are structurally complex ecosystems built over centuries, with layered canopies, deep organic soils, and a carbon density that a young plantation cannot replicate on any relevant timeline.
The system used to define which forests can be harvested consistently misidentifies or excludes these high-value stands from protection, while counting lower-productivity or already-protected areas toward conservation targets. Age thresholds used as proxies for old-growth structure are imprecise. Coarse mapping tools miss the stands that matter most. The stumps documented in Section 3, fourteen to sixteen inches in diameter, still present after 46 years beside four-inch plantation stems, are the physical record of what was classified as harvestable. The gap between the label and the living system is not technical. It is consequential.
E. The Professional Reliance Framework - Where Discretion Enters
In many jurisdictions, the final step between the modelled harvest allowance and the approved cutblock (a delineated area approved for logging, also referred to under the Timber Supply Review, or TSR, process in British Columbia) is a professional judgment made by a forester or engineer retained by the licensee (the timber company or individual holding the legal right to harvest timber from a defined area). Results-based regulatory frameworks place significant interpretive authority in the hands of professionals whose employment relationship creates a structural tension between their obligation to the public interest and their obligation to the client. This is not an accusation of misconduct. It is an observation about system design. When the interpretation of an ambiguous objective is left to a professional hired by the party with a financial interest in the outcome, the structural pressure on that professional is not neutral. It points in a direction. And that direction has historically pointed toward maintaining harvest opportunity.
The Compounded Result
The five steps described above produce correlated errors that accumulate in the same direction: toward a harvest allowance that is higher than a fully honest uncertainty analysis would support.
A harvest allowance carrying ±30 to 60 percent cumulative uncertainty, presented as a single precise figure, is not a measurement. It is a policy choice wearing the clothing of science.
The world builds its carbon future on a number that the forest was never asked to verify. — The Forest
SECTION III
What The Ground Says
A 400-Kilometre Field Survey and What It Found
The argument of the preceding sections is grounded in published science, documented uncertainty ranges, and the structural logic of compounding error. What follows is grounded in something more immediate: a single day's field observation, conducted on 24 June 2026, along a 400-kilometre survey corridor between Kamloops and Kelowna, British Columbia, Canada. The corridor traverses the Coquihalla Highway and the Pennask Summit road, a landscape where the forest management history of the 1970s and 1980s is legible from the road, where plantation establishment dates are documented on industry and government signage, and where a tape measure, a camera, and forty years of waiting have combined to produce an evidence base that the models were never designed to generate.
The sign said: Planted 1988. Storing Carbon. Improving Habitat. The tape measure said something else entirely. Exactly how much carbon is being stored?
A note on methodology: all height estimates are field observations referenced against known scales, standard 4’ × 8’ signage, estimated post heights, and comparative reference to known-height structures. All diameter estimates are visual field assessments at breast height. The author is a geological engineer with nearly four decades of field measurement experience. These are competent field estimates made by a trained observer, documented photographically, and presented as evidence of order of magnitude.
The gap between what the models projected and what the field shows is not measured in inches. It is measured in decades.
Field Stop 1 Coquihalla Highway — approximately 28 km north of Merritt, BC — rocky hillside exposure Survey date: 24 June 2026 Elevation: ~900 m asl |
Planting year: 1988 · Age at survey: 38 years · Height: 16–20 ft · DBH: 4–6 inches · Site: rocky, shallow soil, exposed aspect
At 38 years of age on a rocky hillside with shallow, drought-exposed soil, the trees reach a maximum of 16 to 20 feet with trunk diameters of 4 to 6 inches. The stand is dense and even-aged (a stand in which all trees are of the same age class) with no vertical structure. The forest floor is sparse to barren, needle cast and exposed mineral soil. No snags. No coarse woody debris. No multi-age recruitment. The signage claims carbon storage and habitat improvement. The tape measure and camera document something else.

Note: Establishes site character. Canopy height 16–20 ft visible against skyline.

Note: Documents the public claim. The stand behind it is the ground truth.
Field Stop 2 Coquihalla Highway — approximately 28 km north of Merritt, BC — valley corridor, better soil Survey date: 24 June 2026 Elevation: ~800 m asl (Coldwater River valley corridor) |
Planting year: 1988 · Age at survey: 38 years · Height: ~36 ft · DBH: 6–8 inches · Site: valley corridor, better moisture retention
Two kilometres south of Stop 1, a better-positioned site produces a taller stand. Same planting year, same signage claim. At 38 years the trees reach approximately 36 feet, calibrated against the documented 4’ × 8’ signage on posts at 10 to 12 feet total height. The interior of this stand is where the habitat claim meets its most direct rebuttal: a needle-mat desert with dead lower branches, single canopy layer, no understory. A weathered original-harvest stump to the right of the sign is older than the entire plantation behind it.

Note: Key interior evidence. Rebuttal to habitat improvement claim at 38 years

Note: Scale calibration photograph. Original harvest stump visible at right.
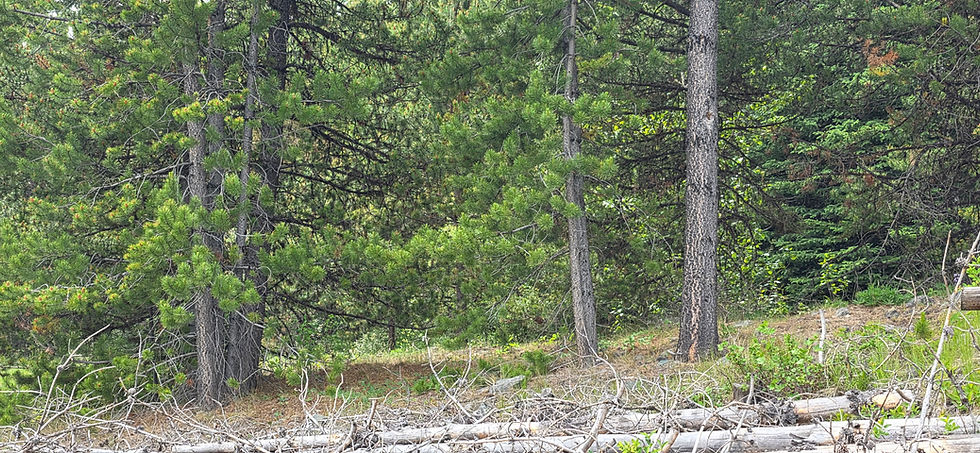
Note: Plantation versus original-stand survivor visible in single frame
Field Stop 3 Coquihalla Highway — approximately 2 km south of Halmer Road, ~28 km south of Merritt Survey date: 24 June 2026 Elevation: ~900 m asl |
Planting year: 1988 · Age at survey: 38 years · Estimated height: ~36 ft · Site: hillside, mixed aspect
Stop 3 produces the survey's most powerful landscape-scale evidence. Photographed from the highway, the hillside presents a visible colour and texture boundary between plantation and original forest that requires no instrument to read. The lighter yellow-green band across the mid-slope is the 1988 plantation, even-aged, uniform, bright juvenile foliage. Above it, the transition to original forest remnants is sharp: darker blue-green, structurally complex, visibly taller. That colour differential is a carbon density map readable from a moving vehicle.

Note: Most important landscape-scale photograph. The boundary is readable without instruments.
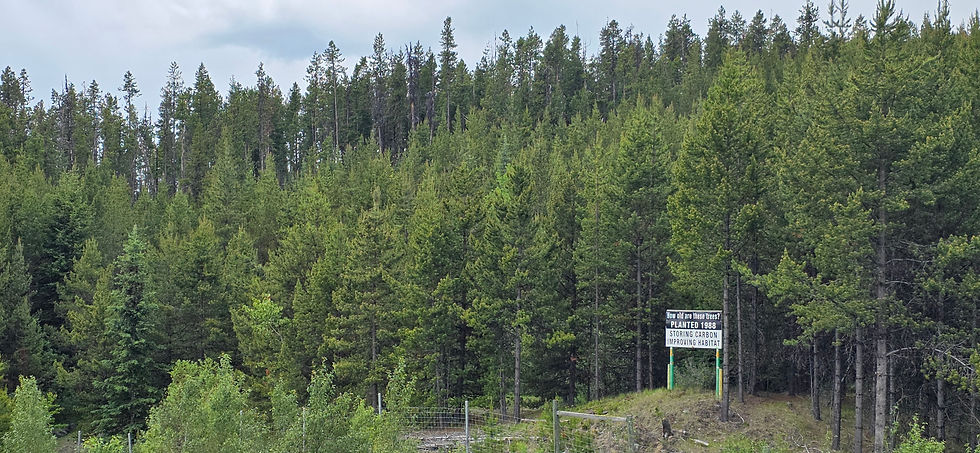
Note: Plantation claim and original forest rebuttal in single frame.
Field Stop 4 Highway 97C — Merritt to Kelowna corridor, north of highway, cutblock landscape documentation Survey date: 24 June 2026 Elevation: ~950 m asl |
Stop 4 documents the landscape-scale consequence of the harvest pattern. The photographs show a biological mosaic: scattered survivor trees on exposed ridgelines; bleached fallen timber across open slopes; early recruitment in patches; and broad areas of shrub-dominated open ground not yet transitioned to any forest cover after many years. On the north-facing slopes, small groupings of saplings struggle under extreme exposure conditions. Elsewhere, broad areas show no recovery at all, ground scalded to bare mineral soil, no recruitment, no cover. A second photograph captures three successional zones simultaneously: dense plantation at lower left, standing dead timber from a prior beetle event across the centre, and open recovering ground to the right. This is cumulative disturbance made visible, a carbon source that has been emitting, unaccounted, since the original harvest.
Stop 4 reframes the harvest-to-establishment gap documented at Gorman Bros. The two-year gap between harvest and planting recorded at Gorman Bros. is the optimistic case, the named exception rather than the rule. What the photographs at Stop 4 document is the typical case: a biological mosaic where meaningful sequestration on any significant portion of the cutblock does not begin for 7 to 15 years after harvest, where saplings struggle for years before canopy closure begins, and where broad areas of the cutblock may never achieve meaningful forest cover at all. The carbon accounting frameworks credit the entire cutblock from planting day. The ground at Stop 4 has been a net carbon source since the harvest, and the models have been counting it as a sink.
The two-year harvest-to-establishment gap is the optimistic case. The photographs at Stop 4 document the typical case. The carbon accounting system has been crediting a sink that the ground says is still a source.

Note: Landscape-scale carbon source. This hillside has been a net carbon emitter since harvest.
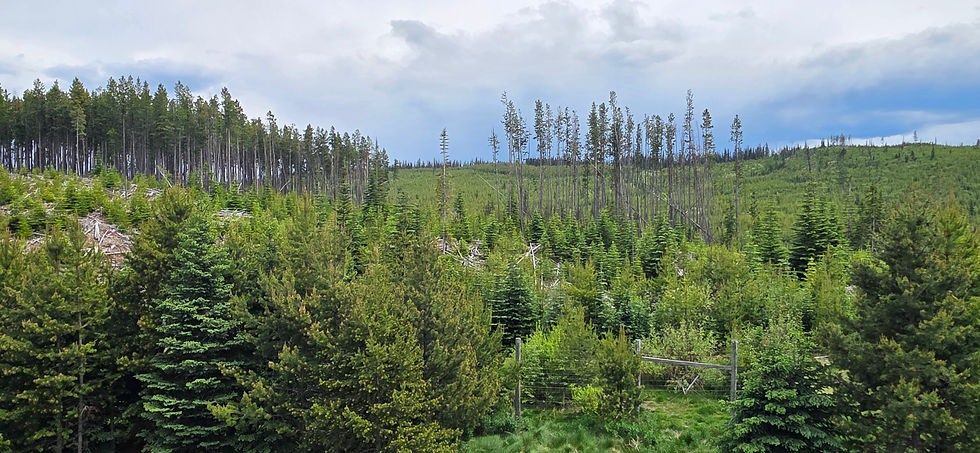
Note: Cumulative disturbance interaction. Multiple overlapping events visible simultaneously.
Field Stop 5 Pennask Summit — near Okanagan Wind Turbines, ~75 km from Kelowna, BC Survey date: 24 June 2026 Elevation: ~1,450 m asl — highest elevation stop in survey |
Planting year: 1984 · Age at survey: 42 years · Height: 36–40 ft · DBH: 6–8 inches · Site: high elevation, shorter growing season
Stop 5 advances the planting date to 1984 and the elevation to approximately 1,450 metres. Four additional years of growth at a site with shorter growing season and greater climate stress. Result: 36 to 40 feet in height with 6 to 8 inch diameters. The defining photograph at this stop is not the sign but the comparison: original-stand remnant trees with bleached grey upper stems, 80 to 100-plus feet, stand beside and behind the 42-year plantation at roughly one-third their height. The original stand survivors and the plantation occupy the same photograph. The size differential is not arguable.

Note: THE key evidentiary photograph of the survey. Height differential of ~60–70%

Note: Landscape-scale colour transition repeating pattern from Stop 3 at higher elevation.
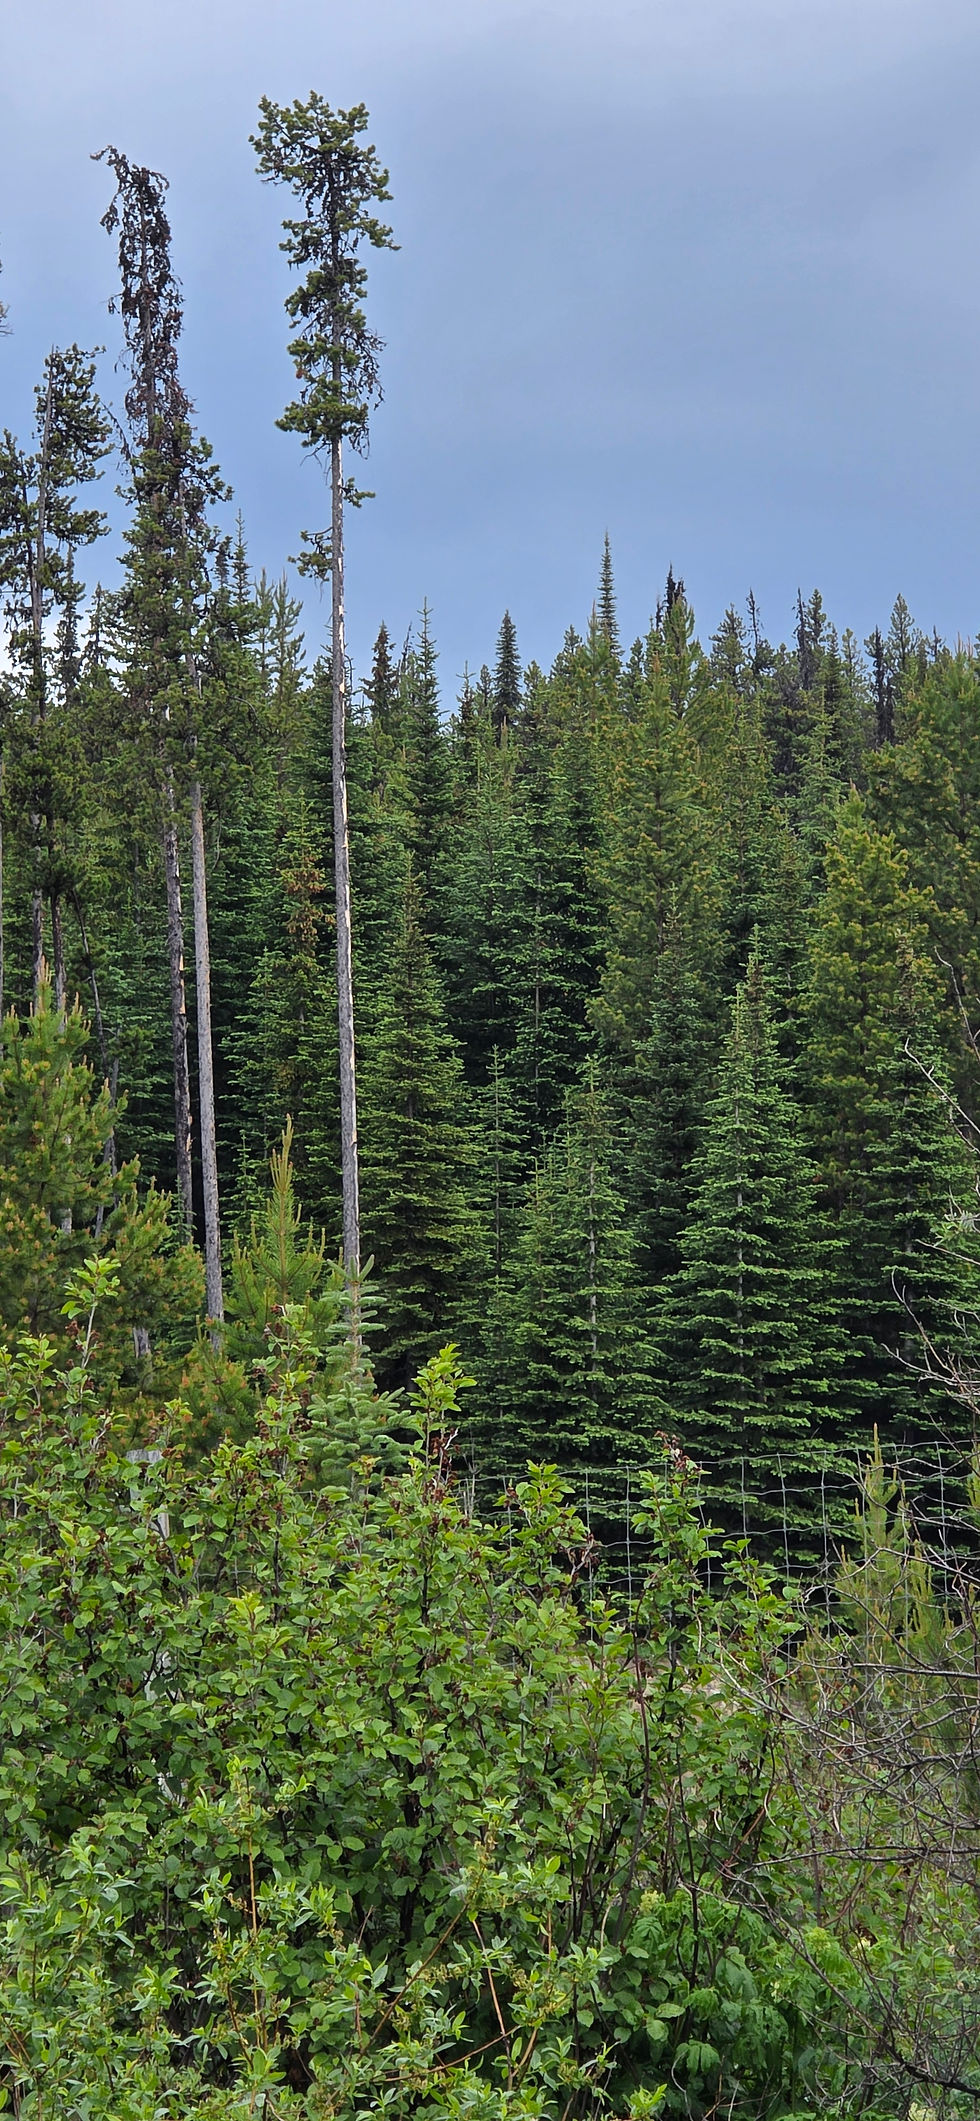
Note: Vertical scale differential visible without measurement. The most direct height comparison in the survey.
Field Stop 6 Pennask Summit corridor — approximately 10 km east of Stop 5 — Gorman Bros. Lumber documented site Survey date: 24 June 2026 Elevation: ~1,380 m asl |
Harvest year: 1978 · Planting year: 1980 · Age at survey: 46 years · Height: 45–55 ft · DBH: 8–10 inches · Original stumps: 14–16 inch diameter
Stop 6 is the evidentiary centrepiece. The roadside signage reads: 'GORMAN, The Finest Boards. NEW FOREST PLANTED 1980. HARVESTED 1978.' A named company. A branded claim. A two-year harvest-to-planting gap before the replacement clock began. At 46 years, this is the best-performing stand in the survey, estimated 45 to 55 feet, 8 to 10 inch diameters. Still a single-layer even-aged monoculture. Still no structural complexity. Still no approach to the ecological function of what was removed in 1978.
In the shadow of the 46-year stand sit the stumps of the original forest: dark, weathered, partially decomposed but reading their dimensions clearly at 14 to 16 inches in diameter. The plantation trees beside them are one-quarter their diameter after 46 years of growth. The stump will outlast the plantation that replaced it.
The stump will outlast the plantation that replaced it. It is decomposing on a century-long timeline, releasing, slowly, the carbon it sequestered when this hillside was still a forest.

Note: Document of record. Named company, dated claim, two-year harvest-to-planting gap implicit in dates.

Note: The defining image of the survey. Stump diameter versus plantation DBH ratio ~2:1 to 4:1.
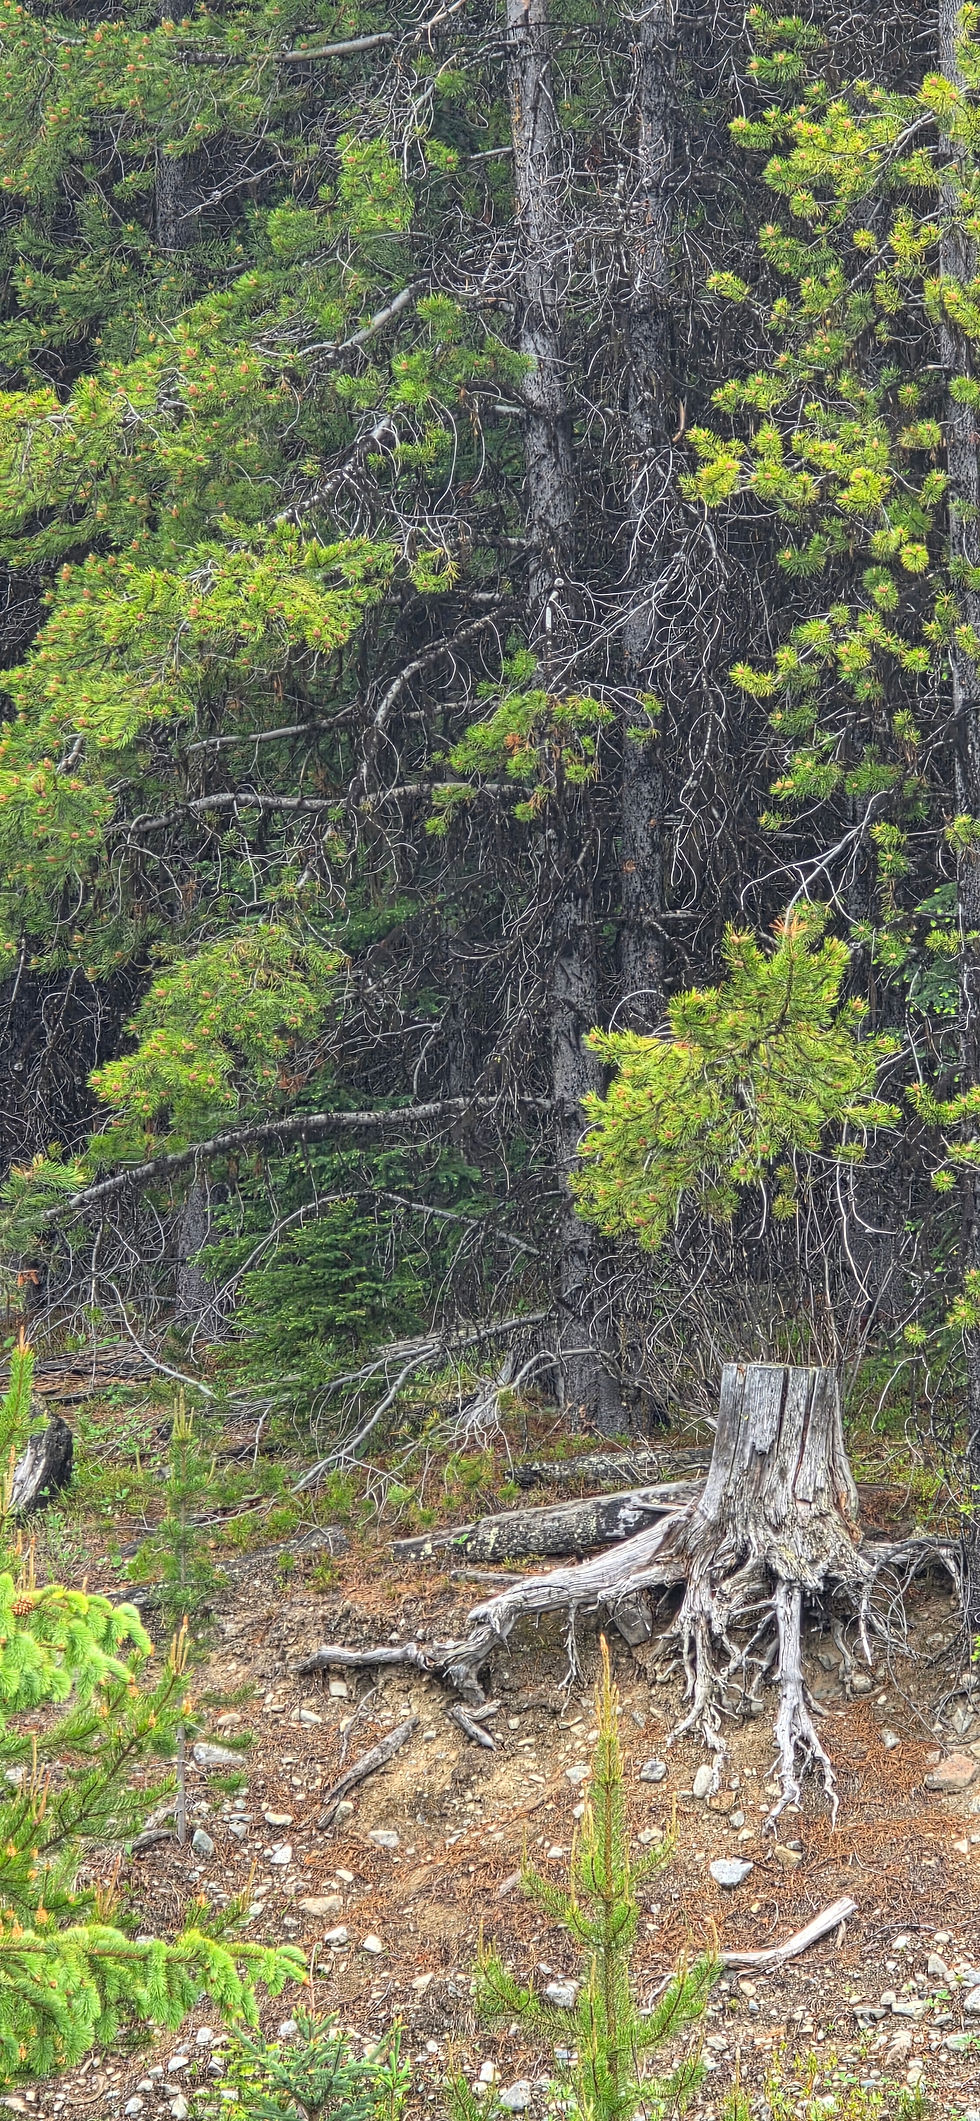
Note: Root buttress spread indicates original tree dimensions. Forest floor: needle mat and bare mineral soil at 46 years.
Survey Summary — Consolidated Field Measurements
Stop | Location | Planted | Age 2026 | Height | DBH | Stumps |
1 | N. of Merritt, rocky hillside | 1988 | 38 yrs | 16–20 ft | 4–6" | No |
2 | N. Merritt, valley corridor | 1988 | 38 yrs | ~36 ft | 6–8" | Yes — 1 |
3 | S. Halmer Rd, S. Merritt | 1988 | 38 yrs | ~36 ft | Est. 6–8" | No |
4 | Hwy 97C, cutblock mosaic | Unknown | Unknown | Fragmented | N/A | No |
5 | Pennask Summit, ~75km Kelowna | 1984 | 42 yrs | 36–40 ft | 6–8" | No |
6 | E. Pennask, Gorman Bros. | 1980 | 46 yrs | 45–55 ft | 8–10" | YES — 14–16" |
What the Ground Says
The forest does not 'grow back.' What grows back is a managed crop, a biological approximation, planted on an industrial timeline, that underperforms its own modelled projections, stores a fraction of the original carbon, and provides a shadow of the habitat it replaced. The original system, built over centuries, sometimes millennia, of accumulated complexity, is not recoverable on any timeline relevant to the carbon crisis now unfolding. What the industry calls reforestation, the stumps at Gorman Bros. call something else entirely.
The carbon credit systems, the EC3 databases, the harvest allowance models, all of them were built on an implicit assumption: that replanted forests would sequester roughly what the models projected. Both assumptions are failing at the same time. The power of error in this paper is not just that individual measurements were wrong. It is that the entire accounting framework was built on baselines that were already eroding, and nobody propagated that uncertainty into the models.
SECTION IV
The Carbon Debt and the Pipeline That Carries It
What Was Promised, What Was Delivered, and Who Is Still Counting on the Promise
The harvest allowances underpinning global forest management carry an undisclosed uncertainty of ±30 to 60 percent [8], directionally biased toward over-harvest. Section 3 documents what that optimism looks like on the ground, with field measurements at six documented sites. This section examines the consequence for the carbon accounting systems built downstream. The question is no longer hypothetical. The field evidence has answered it: the forest is not sequestering carbon on the schedule the models assumed. The question now is what that means for every carbon credit, every embodied carbon calculation, and every sustainability claim built on that assumption.
The carbon credit systems, the EC3 databases, the harvest allowance models, all of them were built on an implicit assumption: that replanted forests would sequester roughly what the models projected. The field evidence suggests they are not. The accounting systems have not made the adjustments.
A. The Carbon Debt — Understanding the Gap
When a forest is harvested, the landscape shifts from a net carbon sink to a net carbon source. Slash decomposition, soil disturbance, root network die-off, and the elimination of living biomass all release stored carbon simultaneously. The replacement plantation begins sequestering carbon slowly, at a fraction of the original capacity. The carbon debt is defined precisely: it is the difference between the carbon sequestration the model projected the plantation would deliver and what the plantation has actually delivered. It has accumulated, unrecorded, in the gap between the sign and the tape measure. Section 3 does not estimate that gap. It documents it.
The debt has three compounding phases, all of which are now field-documented. First, the harvest-to-establishment gap. The Gorman Bros. sign documents a two-year gap between harvest in 1978 and planting in 1980 — two years of unambiguous net carbon emission before the replacement clock began. But Gorman Bros. is the optimistic case. The biological mosaic documented at Stop 4, ground scalded to bare mineral soil, saplings struggling under extreme exposure, broad areas with no recruitment at all, documents the typical case: a cutblock where meaningful sequestration on any significant portion does not begin for 7 to 15 years after harvest. The carbon accounting frameworks credit the entire cutblock from planting day. The ground documents something entirely different.
Second, the juvenile sequestration ramp. From planting through approximately the first 7 to 15 years, field evidence documents essentially zero net sequestration across significant portions of managed cutblocks. From years 15 to 40, sequestration begins on the recovering portions but remains a fraction of mature forest capacity, perhaps 20 to 30 percent on the best-performing sites. The field data from Stops 1 through 5 documents this ramp tracking well below modelled projections at every elevation and site condition surveyed. The growth models assume a smooth recovery curve beginning from planting day. The photographs at Stop 4 document what the early phase of that curve actually looks like on the ground.
Third, the structural carbon gap. Even at full rotation age, a managed plantation stores a fraction of the carbon held in the original old-growth stand. The stumps at Stop 6 are the carbon that was lost. The plantation beside them is the carbon that was supposed to replace it.
They are not equivalent, and they never will be on any timeline relevant to this century.

The red shaded zone between the modelled and actual recovery curves is the carbon debt. It is not zero. It has been accumulating since the harvest era. The grey population line on the right axis is not a carbon variable, it is a demand variable. The carbon budget available per person has shrunk while the plantation has failed to grow fast enough to compensate for the loss of the original stand.
B. The Two-Year Gap Nobody Counted
The Gorman Bros. sign reads: harvested 1978, new forest planted 1980. Two years during which the cleared landscape was an unambiguous net carbon source. That two-year gap does not appear in the carbon accounting for that site. Harvest-to-establishment gaps of one to several years are a standard feature of industrial forestry in every jurisdiction. They are not a standard input in the carbon models that credit managed forests for their sequestration. These gaps, as considered in the 1970s, may have been regarded as inconsequential. In 1970 the global population was 4.29 billion people. In the same period that Gorman Bros. completed their harvest and waited two years to replant, the world added an additional 4.01 billion people, reaching 8.3 billion by 2026. The atmospheric demand those additional billions place on every functioning carbon sink transforms what once seemed a bookkeeping rounding error into a material accounting failure. These gaps are now very consequential.
If harvest-to-establishment gaps are a standard feature of industrial forestry across all major timber-producing jurisdictions, and if those gaps represent periods of net carbon emission not captured in managed forest carbon accounting, what is the aggregate carbon consequence of those gaps across the global managed forest estate? Has that figure been calculated? If so, where is it disclosed?
C. The EC3 Pipeline - Where the Error Goes Next
The carbon debt would be a contained problem if it remained within the forest management system that created it. It does not.
It travels downstream, through Environmental Product Declaration (EPD) databases, embodied carbon tools, certification frameworks, and procurement systems, into the decisions of architects, engineers, developers, and governments who believe they are making choices grounded in reliable carbon science. The primary transmission mechanism for the construction industry is the EC3 database and its integration ecosystem.
EC3, the Embodied Carbon in Construction Calculator, is the primary reference tool for embodied carbon assessment in the North American construction industry. It is not a standalone tool. It is embedded through working integrations into the primary software platforms of the global construction industry:
Platform / Tool | Role in construction industry | EC3 data dependency |
Procore | Dominant construction project management platform; hundreds of billions of dollars of construction annually | EPD data accessible within project management workflow |
Autodesk | Software backbone of virtually every architecture and engineering firm globally | EC3 integration app for embodied carbon estimating |
Bentley / iTwin | Infrastructure digital twin platform used by governments and major engineering firms worldwide | EC3 integrated into infrastructure carbon accounting |
cove.tool | Whole-building carbon simulation for design teams | EC3 data used to simulate complete project carbon profile |
2050 Materials | EPD sourcing and material specification platform | EC3 as primary source of EPD data |
One Click LCA | Most widely used lifecycle carbon assessment tool in green building certification globally | EC3 and One Click LCA integrated; shared data infrastructure |
Sustainable Minds | Product specification platform across North America | EC3 integrated to identify lower embodied carbon products |
Tangible | Embodied carbon impact reporting platform | EC3 integration for embodied carbon reporting |
An architect in Vancouver specifying mass timber in Autodesk draws on EC3 embodied carbon data. An infrastructure engineer in Stockholm using Bentley iTwin draws on EC3 data. A developer in Dubai certifying a building under One Click LCA draws on EC3 data. EC3 data for wood products draws on EPDs grounded in managed forest carbon assumptions. Those assumptions are calibrated against growth models that project plantation performance on recovery curves the field evidence of Section 3 suggests are systematically optimistic. The carpenter's error travels through the EPD, through EC3, through Autodesk, Procore, One Click LCA, and Bentley iTwin, into the embodied carbon calculations of buildings being designed today, in every major construction market in the world — calculations that treat forest carbon assumptions as verified data when the field evidence suggests they are borrowed on error. Every overstatement of wood product carbon neutrality reduces the perceived urgency of protecting the very forest and ocean sinks whose real and remaining capacity is already failing. The significance of these miscalculations does not end at the project boundary.
Every one of these platforms is pulling embodied carbon data that flows from, or is benchmarked against, forest carbon assumptions that field evidence suggests are not holding up on the ground.
A critical question about EC3's architecture must be stated clearly. EC3's verification process confirms that EPD data complies with applicable Life Cycle Assessment (LCA) methodology standards. It does not independently verify that the plantation growth assumptions embedded in wood product EPDs correspond to measured stand performance. The upstream verification gateway under ISO 21930, the international standard governing wood product EPDs, requires confirmation either that the country of wood origin's net carbon stocks are stable or increasing, or that the fiber comes from a certified forest. That is a national-level documentation check or a certification label. It is not a field measurement. No stand-level growth verification is required under the standard, and no protocol for propagating corrections when measured plantation performance diverges from modelled projections appears in publicly available EC3 or EPD programme documentation. EC3 takes the EPD as presented and does not look upstream at whether the forest carbon assumptions behind the EPD are accurate. (Source: ISO 21930:2017, Section 7.2.11; Building Transparency EC3 Methodology documentation, cradle-to-gate A1–A3 scope — both cited in Recommended References.)
D. The Questions the Pipeline Has Not Been Asked
What field validation protocols exist to verify that plantation performance assumptions embedded in wood product EPDs correspond to measured stand conditions? How frequently are those assumptions updated when measured performance diverges from projected performance?
When a wood product EPD claims a specific biogenic carbon sequestration credit, what is the documented provenance of the plantation growth data on which that credit is based? Has that data been independently field-verified at the stand level, or does it rely on national-level stock confirmations and certified forest labels that do not constitute field measurement?
Given that EC3 is integrated into the primary design, project management, and certification tools used across the global construction industry, what mechanism exists to propagate corrections to forest carbon assumptions through the EPD and LCA frameworks into the projects that have already made procurement decisions based on those assumptions?
E. The Mass Timber Credit Claim
The mass timber industry has argued that carbon sequestered in a standing tree is preserved in a mass timber beam, and that this contained carbon should be credited against a building's carbon budget. This paper does not dispute that carbon is stored in wood products. It raises a prior question: if the plantation that produced that wood was not sequestering carbon on the schedule the growth model projected, if the carbon debt documented in Figure 7 is real, then the carbon claimed as stored in the beam was never fully sequestered by the replacement forest in the first place.
The credit for contained carbon cannot be taken against a sequestration that did not occur on the modelled timeline.
The carbon stored in the beam is real. The question is whether the forest that will replace the tree that became the beam is sequestering carbon fast enough to make the accounting honest. The field evidence raises serious doubt that it is.
SECTION V
The Exponential Load Nobody Modelled
The preceding sections have examined one of the three principal carbon sink systems on which the world's climate accounting depends: the terrestrial forest sink. That examination found a system carrying undisclosed uncertainty of ±30 to 60 percent, directionally biased toward overstatement, and delivering sequestration at a fraction of the rates embedded in downstream carbon credit and embodied carbon frameworks.
But the terrestrial forest sink does not operate alone.
The global carbon budget depends on three interlocking systems: the terrestrial biosphere, principally forests; the ocean surface, absorbing roughly 25 to 30 percent of human CO₂ emissions; and the atmospheric chemistry that determines how much of what is emitted stays aloft.
These three systems are not independent. They interact, they amplify each other's failures, and they were all calibrated during a period of relative climatic stability that no longer exists. Section 5 examines what happens when all three are compromised simultaneously, and why no model in the harvest allowance chain was built to account for it.
When Both Sinks Fail at the Same Time
The carbon accounting frameworks examined in this paper were calibrated against a world in which human carbon emissions grew at roughly the rate of population growth, in which the ocean continued absorbing approximately 25 to 30 percent of those emissions, and in which managed forests sequestered carbon at rates consistent with their modelled growth curves. All three assumptions are now in question simultaneously. The failure of any one of them would be serious. The simultaneous failure of all three, in the same decades, on the same planet, against the same atmospheric carbon budget, is a compounding catastrophe that no model in the harvest allowance chain has been built to account for.
Population grew linearly. Carbon loading did not. The accounting frameworks were built for the line. The planet is living on the curve.
A. The Non-Linear Carbon Load
Between 1984 and 2026, world population grew from 4.77 billion to 8.3 billion: an increase of roughly 74 percent. Global CO₂ emissions grew in absolute terms, but the atmospheric carbon load grew faster, driven by three mechanisms that the managed forest carbon accounting frameworks of the early 1980s were not designed to accommodate.
Agricultural deforestation for cattle, soy, and palm oil is responsible for approximately 10 to 15 percent of global greenhouse gas emissions annually. That figure includes land clearing, the eliminated sequestration of the removed forest, and the ongoing carbon emissions from degraded soils, but does not include the methane. Enteric fermentation from ruminant livestock produces methane carrying approximately 80 times the warming potential of CO₂ over a 20-year window. The global ruminant livestock population has expanded dramatically over the same period the plantations documented in Section 3 have been slowly, inadequately growing. And climate feedback acceleration, permafrost thaw, heat and drought stress converting forests from sinks to sources, extended fire seasons, adds further load at precisely the moment when the plantation recovery curves show the managed forest carbon sink at its weakest.
B. The Ocean Pump - The Sink Nobody Talks About Until It Stops
Approximately 50 percent of all photosynthesis on Earth is conducted by phytoplankton, microscopic organisms living in the sunlit upper layer of the sea. They are invisible from the shore. They are absent from every forest carbon accounting framework this paper has examined. And they are in trouble.
Phytoplankton are the foundation of the biological carbon pump. Through photosynthesis they fix dissolved CO₂ into organic carbon, their own biomass. When they die or are consumed, that organic carbon sinks. Carbon reaching the deep ocean is removed from the atmospheric cycle on timescales of centuries to millennia. Where it reaches the seafloor sediments and enters the lithosphere, it is sequestered on geological time.
The biological pump built the coal and oil deposits we are currently burning across hundreds of millions of years of phytoplankton sequestration. We are releasing that carbon in two centuries. And the pump that built those deposits is weakening at precisely the moment we need it most.

Two mechanisms are undermining the pump simultaneously. Thermal stratification: as surface waters warm, the density differential suppressing upwelling of cold, nutrient-rich deep water increases. Phytoplankton starve. Less carbon is fixed. Less sinks. Less reaches depth. More CO₂ remains in the atmosphere. The atmosphere warms further. The loop accelerates. Ocean acidification: CO₂ absorbed by the ocean forms carbonic acid, lowering pH, threatening the calcifying organisms whose shells drive sinking efficiency. Weaker shells, slower sinking, more remineralisation in the water column before carbon reaches depth. The pump loses efficiency at precisely the moment it is being asked to absorb more.
C. The North Atlantic - Where the Pump Is Failing Most Visibly
The Atlantic Meridional Overturning Circulation (AMOC) drives the global thermohaline circulation, distributing heat, nutrients, and carbon around the entire ocean system. Warming and freshwater input from Greenland ice melt are weakening AMOC. A weakened AMOC means reduced nutrient upwelling, reduced phytoplankton productivity, a weakened biological pump, and less carbon reaching the lithospheric boundary where it would be sequestered on geological timescales. Published research indicates AMOC is currently at its weakest point in over a millennium. The system that has been quietly absorbing a quarter of human carbon emissions is losing capacity at precisely the moment when the terrestrial carbon sinks documented in this paper are also underperforming.
D. The Domino Sequence
Stressor | Mechanism | Carbon consequence |
Ocean surface warming | Thermal stratification suppresses upwelling of cold, nutrient-rich deep water to photic zone | Phytoplankton nutrient supply reduced; surface waters become biologically impoverished |
▼ each step amplifies the next ▼ |
|
|
Phytoplankton decline | Reduced photosynthesis; less CO₂ fixed into organic carbon | Biological pump weakens at source; less organic carbon available to sink |
▼ each step amplifies the next ▼ |
|
|
Ocean acidification | CO₂ absorption lowers pH; calcifying organisms produce weaker shells | Sinking efficiency reduced; more carbon remineralised before reaching depth |
▼ each step amplifies the next ▼ |
|
|
AMOC weakening | Greenland meltwater reduces density differential; deep water formation slows | Global nutrient redistribution disrupted; North Atlantic pump further reduced |
▼ each step amplifies the next ▼ |
|
|
Reduced deep sequestration | Less organic carbon crossing thermocline to abyssal zone | Carbon remains in upper ocean, remineralises, returns to atmosphere |
▼ each step amplifies the next ▼ |
|
|
Atmospheric CO₂ rise | Ocean absorbs less; atmosphere retains more; warming accelerates | Feedback loop: further warming drives further stratification, acidification, AMOC weakening |
▼ each step amplifies the next ▼ |
|
|
Terrestrial sink failure | Plantation underperformance documented in Section 3; harvest allowances overstated; carbon debt accumulates unrecorded | Managed forest carbon sink delivering fraction of modelled sequestration; carbon accounting frameworks not adjusted |
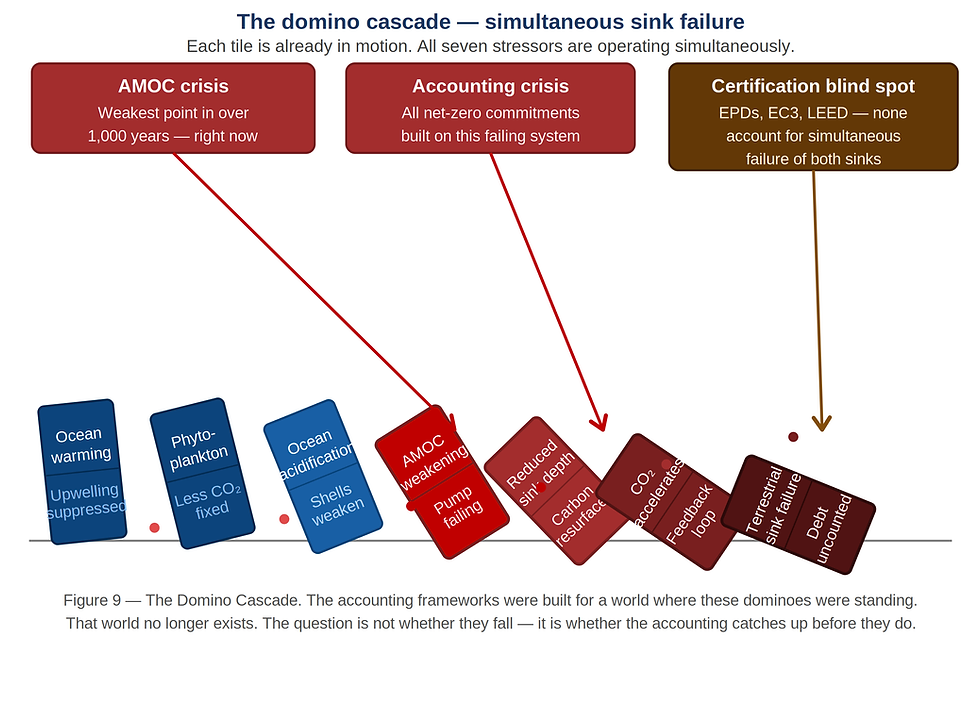
Note: freshwater systems are subject to analogous stressor sequences. Lake thermal stratification, algal bloom displacement of phytoplankton, and acidification in sensitive catchments all reduce freshwater biological carbon uptake by mechanisms parallel to those operating in the ocean. The scale is smaller; the direction of failure is the same.
E. Both Failures Together
The carbon credit systems, the EC3 databases, the harvest allowance models, and the managed forest carbon accounting frameworks examined in this paper were built on two implicit assumptions. First: that replanted forests would sequester carbon on the schedule the growth models projected. Section 3 documents that they are not. Second: that the ocean would continue absorbing roughly 25 to 30 percent of human carbon emissions. The oceanographic evidence summarised in this section suggests that capacity is weakening. [9]
Both assumptions are failing at the same time. The power of error in this paper is not just that individual measurements were wrong. It is that the entire accounting framework was built on baselines that were already eroding, and nobody propagated that uncertainty into the models.
A terrestrial carbon sink underperforming by 30 to 60 percent, in a period when the ocean sink is also weakening, in a period when the atmospheric carbon load is growing non-linearly, produces a carbon budget deficit of an order of magnitude larger than any individual model error would suggest. And the EPD databases, the green building certifications, and the corporate sustainability reports that draw on managed forest carbon assumptions have accounted for none of it.
If the terrestrial carbon sinks are underperforming their modelled projections and the oceanic carbon sink is weakening simultaneously, what is the implied correction to the net carbon budget that underpins current global climate commitments? Has that correction been calculated? Has it been disclosed to the industries, governments, and certification bodies making net-zero commitments based on the uncorrected figures?
SECTION VI
What Truth Looks Like from Central BC
A Geological Engineer, a Tape Measure, and Forty Years of Watching
The argument of this paper has been made in the language of error analysis, uncertainty ranges, and system design. That language is necessary. But it has another register, one that does not require a P.Eng. stamp or familiarity with growth and yield modelling to understand. It requires only a willingness to look at what is there.
I am not a forestry scientist. I am an engineer who knows what a measurement is, what an assumption is, and what happens when you build a structure on a foundation that has not been verified. The forest is the foundation. The accounting is the structure. Neither has been verified at the scale the world is relying on them — in 2026, with 8.4 billion people on the planet.
A. The Forest Cannot Speak
Every institution with authority over forest carbon accounting has a financial or reputational stake in the current system continuing to function as described. The timber licensees whose harvest volumes depend on the Annual Allowable Cut (AAC). The certification bodies whose credibility rests on the assumption that the accounting is sound. The software platforms whose business models depend on the data being reliable. The governments whose climate commitments require the managed forest carbon sink to be counted as functional.
The trees, the soil, the mycorrhizal networks, the phytoplankton in the North Atlantic, the stumps decomposing beside their replacements on a hillside above the Coquihalla, none of them have a seat at the table where the numbers are set. None of them can challenge an EPD. None of them can file a comment on a harvest allowance review. None of them can walk into a green building conference and ask why the growth curves do not match what is growing.
Someone has to do it for them. That is what this paper is.
B. What Nearly Four Decades of Field Work Looks Like
The author's engagement with the relationship between human industry and the natural systems that sustain it did not begin with a white paper. It began in 1986 on Baffin Island in the Canadian Arctic, at a mine site north of the Arctic Circle, where geological formations underfoot and the Inuit community nearby both carried knowledge the engineering models of the time were not designed to receive. It continued through a decade in Guadalajara, where the pace of a single deliberate bricklayer on the Glorieta de La Minerva taught a lesson about precision and patience that no university course had managed to convey. It deepened through field seasons across Central and South America, through relationships with Indigenous communities from the Inuit of Arctic Bay to the First Nations of British Columbia to the Huichol nation of the Sierra Madre, where a land use treaty was signed under giant pine trees at the top of a mountain with eighteen chiefs of the Huichol nation, a document that treated the land not as a resource to be accounted for but as a relationship to be honoured.
What nearly four decades of that kind of field work produces is not a dataset. It produces a calibration. The ability to stand in front of a plantation and know, without a growth model, that what is standing there is not what the model said would be there. The ability to read a hillside from a moving vehicle and see the colour boundary between what was promised and what grew. The ability to stand beside a 46-year-old stump and understand, in the bone, what was lost and what was not replaced.
C. The Herd Culture and the Loud Room
One of the features of the global internet platform era that makes the argument of this paper both more urgent and more difficult is what might be called the herd culture of influence: the tendency of industry lobby groups, marketing departments, and well-funded communications operations to engage social media influencers, populate comment threads, and amplify unsubstantiated claims at a volume and velocity that drowns out slower, more rigorous, more honest analysis.
'The forest grows back.' Four words. Said with confidence. Said loudly. Said by people who have never stood inside a 38-year-old plantation on a rocky hillside north of Merritt and looked at a 4-inch trunk. Said by people who have a financial interest in the listener believing it, and no financial interest in the listener going to check.
This paper does not accuse any institution of lying. It asks a question backed by evidence, directed at institutions that have not publicly addressed it. That is the only instrument available to someone operating from a repurposed shipping container and timber frame home in Vinsulla, BC, with a camera, a tape measure, and a geological engineer's understanding of what happens when you build on an unverified foundation.
D. What This Paper Is Asking For
Specific requests this paper makes of the institutions it addresses: ► Forest management agencies: in all major timber-producing jurisdictions: publish the uncertainty ranges associated with current harvest allowances, including cumulative uncertainty propagated from inventory through to final determination. A single number without a confidence interval is not a defensible scientific output. ► EPD programme operators and LCA practitioners: who generate wood product EPDs: document the field validation protocols used to verify that plantation growth assumptions correspond to measured stand performance. Publish the results. Disclose whether verification is stand-level field measurement or national-level stock confirmation. ► EC3 and its integration partners: establish a data provenance standard for forest carbon assumptions embedded in wood product EPD data. Disclose what field verification, if any, underpins the biogenic carbon credits currently accessible through the platform. The current ISO 21930 gateway is a documentation check, not a field measurement. ► Green building certification bodies: require that mass timber and wood product carbon claims be supported by EPDs whose forest carbon assumptions have been independently field-verified within a defined recency window. ► The global oceanographic and climate science community: continue and accelerate publication of AMOC monitoring data, phytoplankton population trends, and biological pump efficiency measurements in forms accessible to policy and industry communities. ► The construction industry at large: ask the question. When a supplier, certification body, or software platform presents a wood product carbon figure, ask what field evidence supports the plantation growth assumptions behind it. The question is not hostile. It is due diligence. |
E. The Earth Stewardship Orientation
The author's company operates under what it calls an Earth Stewardship orientation, a philosophical commitment rooted in decades of relationship with Indigenous communities and in a geological engineer's understanding that the systems sustaining human life are finite, complex, and far older than the institutions that claim authority over them. Earth stewardship, in the context of this paper, means this: that the obligation of anyone who builds with materials drawn from natural systems is to understand those systems honestly, not as accounting categories, not as carbon credit opportunities, but as living systems whose complexity exceeds our models and whose resilience has limits our models consistently underestimate.
The stumps at Gorman Bros. are not a data point. They are a relationship, between a forest that took centuries to build, an industry that took two years to remove it, a plantation that has spent 46 years failing to replace it, and a carbon accounting system that has spent those same 46 years pretending the replacement was complete.
F. The Closing Argument
The power of error, as this paper has documented it, is not the power of any single mistake. It is the power of a system designed so that optimistic assumptions compound silently across every decision point, travel invisibly through every downstream framework, and arrive at the end of the chain wearing the authority of precision, a certified product, a verified claim, that the original measurement never earned and the field never confirmed.
The carpenter's lesson is simple. The forest is the original standard. The question no step in the chain has systematically asked is: when did anyone last measure from the original? The answer, at six field stops along a 400-kilometre corridor in interior British Columbia, Canada, is: not recently enough. The trees are smaller than the models said they would be. The stumps are larger than the replacements beside them. The floor is bare where the habitat claim said it would be rich.
This paper walked around to the other side of the sign. What it found is documented in the photographs, the field measurements, and the analysis of the preceding sections. What it asks is simple: go and look. Send someone with a tape measure. Publish what they find. Adjust the models to match the ground, not the other way around.
The forest cannot ask for that. The ocean cannot ask for that. The mycorrhizal networks and the phytoplankton and the 46-year-old stumps cannot ask for that.
The forest does not 'grow back.' What grows back is a managed crop, a biological approximation, planted on an industrial timeline, that underperforms its own modelled projections, stores a fraction of the original carbon, and provides a shadow of the habitat it replaced. The original system, built over centuries, sometimes millennia, of accumulated complexity, is not recoverable on any timeline relevant to the carbon crisis now unfolding. What the industry calls reforestation, the stumps call something else entirely.
The goal is not to make people feel attacked. It is to make them unable to avoid the question.
Acknowledgements
The author acknowledges the Indigenous peoples on whose territories the field survey documented in this paper was conducted, the Nlaka'pamux, Syilx Okanagan, and Secwépemc Nations, and recognises their ancestral and ongoing relationships with the forests, waters, and lands this paper examines. Their knowledge of those systems predates and exceeds the modelling frameworks this paper critiques.
The field survey was conducted independently, without institutional funding or affiliation. This paper was prepared with AI writing assistance from Anthropic Claude. All field observations, evidentiary interpretation, primary arguments, and conclusions are the author's own.
References
[1] Dellert, L.H. (1994). Sustained Yield: Why Canada Embraced the Concept but Rejected its Limits. Historical foundation for why the AAC system was built the way it was and what values were embedded in it from the start. Supports Section 1 and Section 2 structural bias argument.
[2] Parfitt, B. (2020). Turning Point: BC's Forest Carbon at a Crossroads. Canadian Centre for Policy Alternatives. Directly relevant to BC harvest allowance uncertainty ranges cited in Section 2, including growth and yield modelling limitations and the gap between modelled and measured stand performance.
[3] Gorley, A. & Merkel, G. (2020). A New Future for Old Forests. BC Old Growth Strategic Review. Supports Section 2D old-growth classification argument. Inventory limitations as a constraint on old-growth determination are referenced directly.
[4] Bradshaw, C.J.A. et al. (2022). Underestimating the Challenges of Avoiding a Ghastly Future. Frontiers in Conservation Science. Supports the cumulative underestimation argument in Section 2 and the compounding failure argument in Section 5. Directly supports the natural disturbance uncertainty range.
[5] ISO 21930:2017. Sustainability in buildings and civil engineering works — Core rules for environmental product declarations of construction products and services. Section 7.2.11 governs biogenic carbon claims in wood product EPDs and constitutes the verification gateway examined in Section 4C.
[6] Building Transparency / Carbon Leadership Forum. EC3 Tool Methodology (2019, updated). Documents the cradle-to-gate A1–A3 scope and EPD data intake process. No stand-level field validation protocol for forest carbon assumptions is documented. Directly cited in Section 4C.
[7] Profitt, J. (June 2026). The Carbon Accounting Reckoning. Nextlevel Modular Inc. The preceding paper in this research program, examining structural errors in forest carbon accounting frameworks. Part 1 of this series.
[8] Profitt, J. (2026). Cumulative Harvest Allowance Uncertainty — Methodology Note. The uncertainty ranges cited in references [1] through [4] were compounded through the harvest determination chain using standard engineering error propagation methodology. Each uncertainty range applies to the output of the preceding step rather than adding linearly to the published figure. Applying midpoint estimates at each step — inventory ±25%, growth and yield ±22%, disturbance ±40%, old-growth and professional reliance ±25% — produces a defensible AAC of approximately 25 to 30 percent of the published figure, representing a cumulative overstatement of 70 to 75 percent. Expressed as an uncertainty range around the published figure this is ±30 to 60 percent, with the directional bias consistently toward the optimistic end at every step. No jurisdiction examined for this paper has published a confidence interval for its Annual Allowable Cut that accounts for compounded uncertainty across all four steps. The absence of that figure is itself a finding of this paper.
[9] Multiple published sources support the weakening of ocean carbon sink capacity documented in Section 5. Boyce, D.G., Lewis, M.R. & Worm, B. (2010). Global phytoplankton decline over the past century. Nature, 466, 591–596. Documents a 40 percent decline in phytoplankton concentration in the upper ocean since 1950. Caesar, L. et al. (2021). Current Atlantic Meridional Overturning Circulation weakest in last millennium. Nature Geoscience, 14, 118–120. Provides the 1,000-year AMOC weakness finding cited in Section 5C. Friedlingstein, P. et al. (2022). Global Carbon Budget 2022. Earth System Science Data. Documents the declining efficiency of ocean carbon uptake. Orr, J.C. et al. (2005). Anthropogenic ocean acidification over the twenty-first century and its impact on calcifying organisms. Nature, 437, 681–686. Foundational study on acidification effects on the calcifying organisms whose shells drive biological pump sinking efficiency.
About the Author
John Profitt, B.Sc., P.Eng., GSC, LEED AP® is Principal of Nextlevel Modular Inc., a BC-licensed residential builder and USGBC member company operating from a repurposed shipping container and timber frame home in Vinsulla, British Columbia, Canada. He holds individual membership in the Canada Green Building Council and is registered as a Professional Engineer with Engineers and Geoscientists of British Columbia. He brings nearly four decades of construction and geological engineering experience across North and South America, including field work with Indigenous communities across Canada and Mexico.
His previous publication, 'The Carbon Accounting Reckoning' (June 2026), examined structural errors in forest carbon accounting frameworks and was distributed to attendees of the National Embodied Carbon Summit at Building Lasting Change 2026 in Montreal, reaching the Deputy Minister of Natural Resources Canada and senior officials across the Canadian construction and forestry sectors.
AI Transparency Disclosure: This paper was prepared with AI writing assistance from Anthropic Claude (claude.ai). All field observations, data collection, evidentiary interpretation, primary arguments, analytical conclusions, and professional judgments are the sole work of John Profitt, B.Sc., P.Eng. AI assistance was used for drafting, editing, and structural organisation of the written text. The author takes full professional responsibility for the content of this paper.


Comments